The experimental system was tested in a heterogeneous environment, with three observers running under different operating systems connected to the Ethernet LAN. Individual applications within the system (the agent program, the observer program, calibration and testing utilities) were built from the version control system managed library containing about 50000 lines of C++ source code.
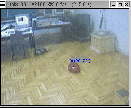
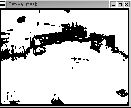
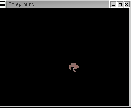
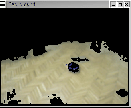
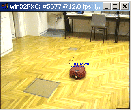
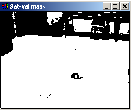
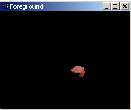
Fig. 7 shows experimental results for the two observers tracking the same object. In the experimental implementation, the objects are detected on the basis of their colour and the colour of the surrounding background. For each observer, the figure shows the original image with the designated detected object (a,e), the saturation-value mask used for eliminating regions that are too dark or too light (b,f), and connected regions which are, according to the hue of the corresponding pixels, classified as objects (c,g) or background (d,h).
|
One of the observers was running on a multiprocessor computer which made it possible to run the coordinator on the same computer without a performance hit. Simple but effective procedures for object detection and tracking allowed for high observer performance of 12.5 Hz and 9.1 Hz on computers with approximate single processor SPEC CINT2000 base performances of 710 and 530, respectively.
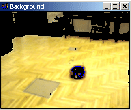
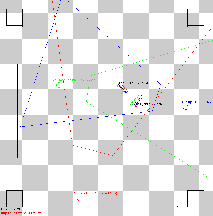
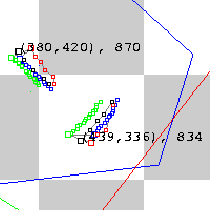
Fig. 8 shows the top view of the scene with two objects moving at speeds of about 0.5 m/s, which is computed in real time within the coordinator agent. The figure background contains the referent one-metre grid and the walls of the lab in which the experiment takes place. Each of the three registered observers is designated with the circle indicating the observer position, the short line showing its orientation, and the polygonal area designating the respective fields of view. Finally, the detected objects are designated with their last positions and recent trajectory segments (as reported by observers), as well as with positions, approximate areas and trajectories of the respective top level blackboard objects.
|